The post Government Info-Tech Research Officer “Track[s] Emotions in Novels and Fairy Tales” appeared first on &.
]]>“Empirical assessment of emotions in literary texts has sometimes relied on human annotation” but now an algorithmic “system determines which of the words exist in our emotion lexicon and calculates ratios such as the number of words associated with an emotion to the total number of emotion words in the text” for novels, Shakespeare, and Brothers Grimm fairy tales (pp. 2, 3). There are no references to Franco Moretti, literary criticism and critical theory, or precedents in fairy-tale analysis such as the ATU Index. Google’s n-gram corpus data and visualization software, which allows you to “Search lots of books” (as opposed to a specific number? are we simply drawing lots? from the “mind of God,” as a Google co-founder once famously called Google), is the Script/ure used (examples of Google data visualizations here).
NRC author Saif Mohammed sees a bright future for the technology in affect surveillance: “Ultimately, he thinks emotion-based software may help us better keep tabs on depression or online harassment and bullying, track emotions on Twitter to forecast riots and better deploy resources, or measure sentiment towards government policies and controversial issues.”
The post Government Info-Tech Research Officer “Track[s] Emotions in Novels and Fairy Tales” appeared first on &.
]]>The post Data Analysis and Hypothetical Reality: The Q Document as a Citable Source appeared first on &.
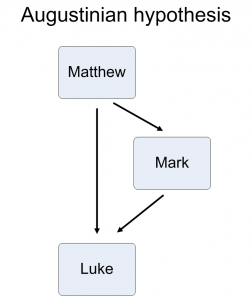
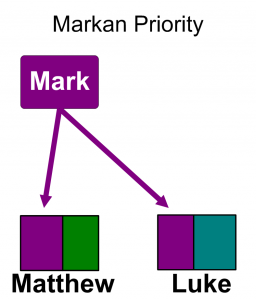
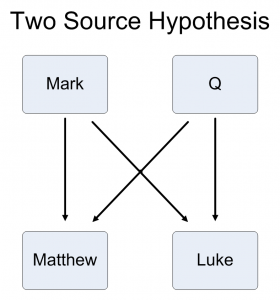
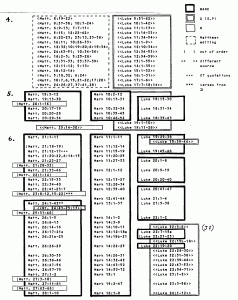
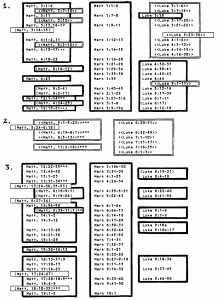
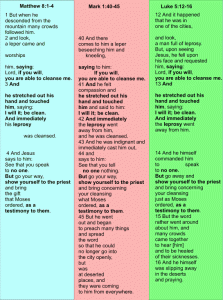
]]>Major issues with the Markan model ensured that further scholarly excavations were necessary. Shared material in Matthew and Luke that is not evident in Mark invited a more rigorous analysis of the complex relational materials in all three Gospels. A two- source hypothesis was developed in the nineteenth Century based upon a new more secularized and scientifically grounded scholarly approach. Quantitative analysis allowed for the building of graphic models and charts that cross referenced the Gospels through the individual words and phrases that were common to at least two of the texts and demarcated those gaps or “empty spaces” that separated the structural and compositional characteristics of the three narratives. This visualizing procedure enabled scholars to refine their analysis and introduce the post-enlightenment emphasis on “reason” to a field of research hitherto relegated to the realm of transcendental divinity. The resulting graphic postulations evolved into what has been designated as the Quelle (Q) source – a reconstructed document – a sayings collection that works as a corollary to the Two Document Hypothesis (2DH).
This simplified graph derived from the complicated charts that were painstakingly pieced together through the process of close reading.
This was, of course, before the digital age and close reading was the only option. It does, however, suggest that the scientific approach to textual analysis and thematic determinations was employed in relation to acceptable texts deemed to be of great importance. The hierarchical position of the bible in the nineteenth Century ensured its prominence within the social networks that enabled the proliferation of new discursive formulations that contributed to the emergence of a more secularized modernist sensibility. The advent of scientific methodology was recognized as a constructive tool in the approach to and analysis of a transcendental socio-political institutionalized cosmological foundational text that touched and influenced most aspects of Western civilization’s development through discursive networks that embraced most elements of the social. Scientific developments in the cultural transformation of the post enlightenment era remodeled perceptions and perspectives even within the realm of the sacred: “The ‘Synoptic Problem’ or the question of the literary relationships among the Gospels is rather like the nuclear physics of biblical criticism, full of mathematics, charts, and algebraic unknowns. Yet like physics, it remains a fundamental building block of other types of Synoptic analysis” (Kloppenborg 12).
A new discursive entity was formulated based on a hypothetical conclusion grounded on a data driven methodology that was achievable due to the limited contents of a theologically constructed canon of redacted and compromised texts. What is ingenious to this hypothetical document is its developmental status within the academic discourse of biblical studies. Unlike the canonical texts of the bible, there is no empirical evidence of the Q document’s existence. There is no archeological affirmation or patristic reference to such a text. It is a purely hypothetical construction seemingly lacking in any concrete materiality. Yet, in the discursive realm of biblical scholarship it contains substance and body. It is referenced and cited and scholars have reconstructed a text, proclaiming it to be the actual Q source:http://www.earlychristianwritings.com/text/q-funk.html. In other words, through a scientific based data retrieval methodology, an ancient (new) sacred text has been introduced to the academic community and has been given an actual tangible materiality. Once this materiality and status is bestowed upon the data based hypothesis, the quantitative research that commenced the project is transformed – it is no longer “data which is ideally independent of interpretations” (Moretti 72) – it is now subject to the same scrutiny and transcendent hermeneutic rigor that is applied to the other texts designated as “sacred”. As such, it is no longer relegated to the discursive networks surrounding the objects of inquiry, it becomes an object in itself and cannot escape interpretative analysis as it is subsumed into the materiality of the actual texts (Gospels): “Q came to be regarded, not merely as an interesting idea for solving the Synoptic Problem, but a significant documentary source for the transmission of the Jesus tradition”(Kloppenborg 5, italics in text).
The reliance on a close reading in order to accumulate the necessary data was a manageable task because of the dismissal and suppression of alternative readings and texts related to the Jesus movement. The political enactment of a power based purging of competing ideologies related to the Jesus moment silenced a wide range of discursive networks that freely flowed during the first two to three centuries of the common era. The proto-orthodox attempts to eradicate alternative interpretations and narratives not only led to the classification of the so-called gnostic texts as heretical, but also led to the destruction of most manifestations of those alternative views. Their existence was only known through the writings of such early church fathers as Irenaeus and his second Century five-volume text entitled “Against Heresies”. The discovery in Egypt in 1945 of the Nag Hammadi Scriptures – fifty-two mainly Gnostic tractates – confirmed the existence of these alternative “Christianities” and incited a new discursive rupture within the academy. While the transformational impact of these discoveries and the radical transmutation of the discursive networks that mold the interiority of Religion and Theology Departments is vital in terms of the foundational stability of scholarly methodological procedures (the need to reassess much of the research in light of the new discoveries has opened up a number of new avenues – networks? – for scholarship in these disciplines), the introduction of new authentic early Christian texts to the discourse surrounding and shaping the networks that define the “space” of biblical investigation will encourage a more intensified statistical analysis.
Moretti suggests that his methodology does not necessitate the establishment of a solution to the problems that may arise: “I had found a problem for which I had absolutely no solution. And problems without a solution are exactly what we need in a field like ours, where we are used to asking only those questions for which we already have an answer” (Moretti 86 italics in text).This seems to be appropriately relevant in relation to biblical studies where transcendental hermeneutic inquiry is often insistent in confirming or disproving a dogmatic established conclusion. Until the nineteenth Century there was a conformity within the field that rarely excluded the belief in an existent divine authority that somehow lurked within the canonical texts even if the allegorical and metaphoric qualities were recognized and rational exegesis dismissed those aspects of the texts that were outside of rational acceptance. Rudolph Bultmann’s demythological approach acknowledged mythological exhortations of the biblical stories as impossibilities and proposed a re-mythological rendering of the bible so as to make it more palatable to the rational mind. But, he was still determined to establish the “truth” of divine revelation that he believed lurked beneath the hyperbolic narrative. The problems that the texts posed needed new and modern solutions. The answer was embedded somewhere within the discourse and networks and the analysis only needed to find a “new” means by which to extrapolate those hermeneutic certainties.The revelation of new contemporaneous texts has already invoked a remodeling of the fluctuating possibilities involved in new modes of theoretical critical approaches to biblical scholarship. The statistical possibilities of the digital advantages in terms of compiling data has already yielded or established new networks that are scraping the borders of the multiplicity of “spaces” that circulate within the academic spheres and are invading those spaces. The Gospel of Thomas has added a strong argument to the validity of the Q source as the sayings genre now has an evidential model for comparison. New charts and graphs have correlated these newly discovered sayings to those of Matthew and Luke and, in turn, to the constructed Q document. Other documents from Nag Hammadi have allowed scholars of Gnosticism to seek out further threads of discourse that relate to the heretical designations of the second Century exposing the political machinations of the proto Orthodox hierarchy. Oblique condemnations are now matched to the actual texts and clarify distinct disagreements and striking similarities between those texts that were canonized and those that were purged. Much of this analysis is greatly facilitated by the technological tools now available as well as the theoretical approaches that evolved from those tools. Piper’s argument that “When we read topologically we are reading our way through language’s historical entanglements” (Piper 378) seems apt in this context. Topology speaks of “a relation … as a conjunction of likeness and difference … the study of ration, neither the attempt to subsume difference nor to assert it absolutely … a form of reticulation, a study of the differences that reside within likeness and the likenesses that span difference (Piper 379-380). The historical critical method of Redaction criticism can now perform a style of topological distant reading in so far as the multitude of variants of any single Christian text or phrase within the text can be excavated through technological means and that same phrase or word can then be correlated (in terms of likeness and difference) to any of the other texts that are within the parameters of early Christian writings.
As the value of the non-canonical texts is recognized the need to utilize digital tools becomes obviously more relevant. The exclusivity of the biblical canon maintained a manageable corpus of textual materials. The borders that protected that exclusivity are being manipulated and the entire field of biblical scholarship is becoming susceptible to new theoretical propositions to accompany the growing number of non-canonical texts that have proclaimed (or are being proclaimed) their relevancy. In this way, biblical scholarship participates in the growth of technological assistance in scholarly inquiry. Established modes of thinking are being challenged and Christological, soteriological and eschatological paradigms are being reformulated as a result of changing discourses and evolving networks that are circulating and transforming the “sacred” landscape. But the old discursive forces that have circulated around the bible for the last two thousand years have an entrenched transcendental flavor that permeates western society well beyond the confines of biblical academia and these circulating agencies have contingency values that are predicated on hermeneutic absolutism that involve solutions that have been used to justify all manner of human behavior. That insistence on an interpretative objective remains firmly rooted in Theological studies and while the theoretical postulations that focus on the communicative pathways of flowing discourses are acknowledged and explored, the formulation, embrace and incorporation within the materiality of an established corpus of actualized physical “sacred” texts of a theoretical fabrication with no empirical or corporeal existence suggests a continued resistance that demonstrates little evidence of abating.
Works Cited
Kloppenborg, John S., Excavating Q: The History and Setting of the Sayings Gospel. Minneapolis: Fortress Press, 2000. Print
Moretti, Franco. “Graphs, Maps, Trees.” New Left Review 24 (Nov-Dec 2003): 67-913 Web.
Piper, Andrew. “Reading’s Refrain: From Bibliography to Topology.” English Literary History 80 (2013): 373-399. Web.
The post Data Analysis and Hypothetical Reality: The Q Document as a Citable Source appeared first on &.
]]>The post Probe: Infographics for Graphic Lit appeared first on &.
]]>How can quantitative data gathering allow us to perform qualitative analysis?
What work do charts and graphs perform on other media, as media themselves?
I had a difficult time writing this piece. I knew what I wanted to use, but I wasn’t quite sure what to make of my object. Much like a topological analysis, the data was all there, but it was on me to decide what to do with it. In this week’s readings, our thinkers focus in on macro- and micro-cosmic views of literature: Moretti on the large sea changes of genre and trend over time, Piper on the recurrent aspects of language in individual oeuvres. I admit closing my laptop just a little frustrated–both had focused on easily extrapolated data (well, perhaps easily is not the right word so much as simply). Where, I thought, were the topological and graphic representations of works that are constituted by a more nuanced system of signs, such as brushstroke, paint viscosity or movement? Even better, where were those that performed readings of inherently intertextual media, where more than one system of signs is at play at all times? This is the kind of thinking that’s led me directly into my research focus. For the past two years, I’ve been part of a research team (along with Darren Wershler and Shannon Tien) studying the habits of underground comics scanners, digital pirates who disperse comics online via bitTorrent sites and file lockers. A big part of our project has been backtracking through almost a decade of illicit uploads to interrogate the rhetoric of both the groups themselves and the large corporations who decry media pirates as predatory profiteers. We have initial findings out in Amodern with more research pieces on the way, but it’s taken us a long time with limited resources. I think part of what excites all three of us about the project is that when we performed our literature review, there didn’t seem to be anything else out there like what we were doing in comics studies. But a lot changes in two years, so I’ve decided to take this opportunity to look at topologies and quantitative methods of analyzing comics–those few that exist–to see how well graphs can represent the simultaneously textual and graphic.
When Friedrich Kittler talks about media, he often frames them in terms of their functions, functions he lays out as recording, storage, and transmission. How do infographics and charts work as a medium, on other media? Recording here means the gathering up of simultaneity in visual form; storage refers to the overlaying of different temporalities and cycles in a single measure; and transmission we can think of in terms of circulation as proposed by Gaonkar and Povinelli. So these charts then are conduits for the data they contain, but can also be seen as powerful tools for shaping data itself and the cultures that produce and consume them. Following Madeline Akrich, I want to argue that technical objects like charts and graphs participate in building heterogeneous networks that bring together actants of all types and sizes, whether humans or nonhuman (Akrich 206). To this end, I think we can use quantitative methods to make qualitative statements not just about content and form (as if those weren’t enough), but also about cultures of exchange and the ideological protocols underlying cultural production.
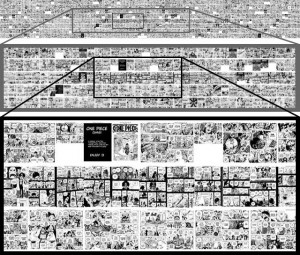
Take for example the One Million Manga Pages Project. This ambitious endeavour downloaded content of almost 900 manga series available as ‘scanlations’ (fan-translated and digitally circulated Japanese comics) on onemanga.com (as well as user-generated metadata like genre demographic tags) and then began using supercomputer-powered custom digital image analysis software to detect trends and variations in the graphical languages of manga. (Manovich et al 192). The One Million Manga Pages Project is not just geared toward analyzing the tropes of manga qua manga; it’s also directed at using this initial large data set as an exemplar for future digital humanities research. At the same time that the project is striving to make qualitative statements about manga as a culture industry, however, it’s also necessarily gathering information about the circulatory practices of manga in fan communities. By doing something as simple as examining the quality of scanned pages and then cross-referencing the types of series being scanned, the project can try to identify the common features of scanlation culture and manga itself simultaneously without depending on expressions of rhetoric that are undoubtedly biased. As the saying goes, a picture never lies. An easy finding? In figure 1 we see how black indicates the ‘credits page’ scanlators attach to their translated and scanned files, while white points towards manga tropes of two page splash spreads and black border indicates the occurrence of flashbacks. Now that the tropes are positively identified, it’s much easier to pose questions of why and how.
(figure 1: zoom ins of the One Piece visualization, a grid composed of some 10,461 pages. Manovich et al. 208)
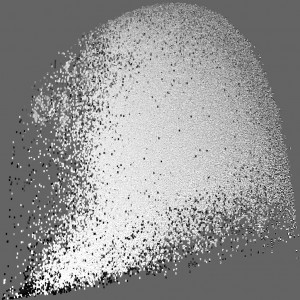
But what does a million pages of fan-translated and scanned manga actually look like? Again, it depends of the kinds of questions you want to ask. Here they are when what you want to know about is the contrast of texture and color scale (fig. 2):
(figure 2: 1,074,790 pages of manga graphed where the vertical represents articulation and the horizontal represents the range of grey tones. Manovich et al. 222)
Here the quantitative question pertained to how gradations of gray tones related to fine texture and amounts of detail. The vertical (Y) axis charts the increasing use of fine linework on a page on the ascent, while the horizontal (X) axis charts the diversity of gray tones on the page with the right trajectory indicating nuance. From here, the project can ask all sorts of qualitative questions, from questions of the ‘style space’ to whether or not distinct and systematic visual differences exist between mangas created for different ages and genders (Manovich et al 223).
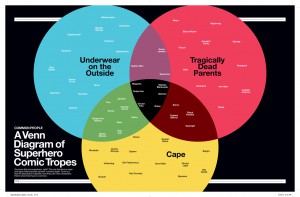
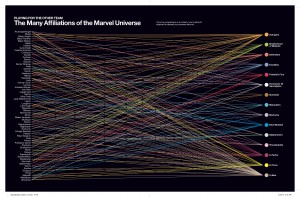
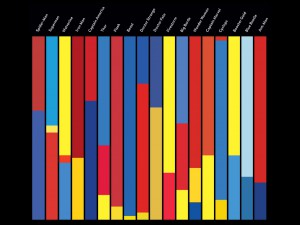
While massive data sets can give us knowledge about comics technique, it only takes one person with a large collection and a creative eye to visualize comics content in an revealing way. Graphic designer Tim Leong’s Super Graphic consists largely of entertaining topologies (fig. 3) and selective and somewhat subjective fan service (fig. 4), but also contains a lot of useful reference material for sorting out comics content. From disentangling decades of convoluted continuity in one chart (fig. 5) to identifying the color tropes of morality in mainstream American superhero comics (fig. 6), Leong may have, however inadvertently, created a useful reference handbook that can help guide not only scalar readings, but close readings as well.
(figure 3: Batman theme quantified. Leong 34)
(figure 4: superhero venn diagram. Leong 12-13)
(figure 5: Marvel hero affiliation chart. Leong 74-75)
(figure 6: apparently, good and evil are a matter of primary and secondary. Leong 10-11)
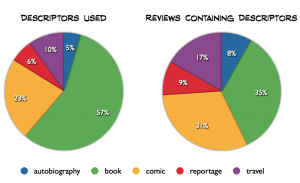
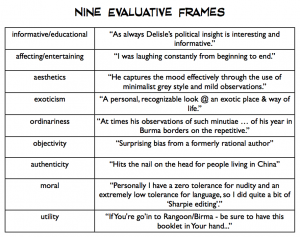
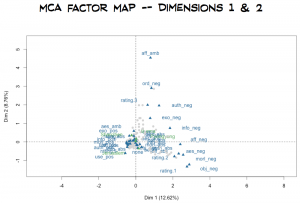
These quantitative scalar methods are also being used to analyze reception of comics works, which in turn can help us figure out how we want to go about generically categorizing works in a field that has always proven notoriously difficult to classify (Delany 1999, Meskin 2007, Groensteen 2006). Comics scholar Ben Woo has performed a study of Quebecois cartoonist Guy Delisle’s oeuvre using Amazon.com reader reviews to see how audiences collectively aggregate description. Poring over reviews of Delisle’s books looking for descriptors (fig. 7), Woo was able to build evaluative frames that he then charted in a multiple correspondence graph where proximity is based on similarity (figs. 8-9).
(figure 7: reviews of Guy Delisle’s books sorted into genre descriptors. Woo slide 8)
(figure 8: the evaluative frames Woo generated based on the reviews he examined. Woo slide 12)
(figure 9: this multiple correspondence analysis of Delisle reviews has allowed Woo to observe that those who dislike Delisle’s work have a higher variation of reasons for doing so than those who enjoy the books. Woo slide 14)
This allows us to gauge the trackable response to Delisle’s work based not on official press reviews or a simple metacritic number, but instead on the classifications made by casual readers, evaluations Woo has even been able to sift into areas based on ambiguousness of commentary and positivity indexes. In figure 9, we can observe that negative or lukewarm reviews are more varying from one another than the positive reviews, which are very tightly packed close to the origin in the lower left. This type of research allows us to make both statements of individual stories and the formal qualities of opinions made within certain communities.
While it would be nice if these examples represented just the tip of the iceberg of serious investigations into graphing and charting comics, it actually comprises the bulk of the investigation out there. Still, I’m disappointed. I have yet to find any form of surface reading that allows for analysis of both the textual and graphic content of comics simultaneously. Again, I’m left wondering if more perfect forms of analysis might exist. Certainly the project best suited to such a task is the One Million Manga pages endeavour, which could perhaps augment its programming to include the translated textuality of the scanlations it studies. Still, it’s clear that graphically representing these objects reveals a great deal about both the ways that the texts are produced and our own habits in actively consuming them. Moreover, it seems that this form of surface reading actually also allows for some depth analysis, even if that analysis doesn’t necessarily follow along with a hermeneutics of suspicion.
Works Cited
Akrich, Madeline. “The De-Scription of Technical Objects.” Shaping Technology/Building Society: Studies in Sociotechnical Change. Ed. Wiebe E. Bijker & John Law. London: MIT Press, 1992.
Delany, Samuel R. “The Politics of Paraliterary Criticism.” Shorter Views: Queer Thoughts & the Politics of the Paraliterary. Hanover: Wesleyan University Press, 1999.
Gaonkar, Dilip Parameshwar, & Elizabeth A. Povinelli. “Technologies of Public Forms: Circulation, Transfiguration, Recognition.” Public Culture 15.3 (2003): 385-97.
Groensteen, Thierry. The System of Comics. Trans. Bart Beaty and Nick Nguyen. Jackson: University Press of Mississippi, 2007.
Kittler, Friedrich. “The History of Communication Media.” Global Algorithm 114 (1996): n. pag. Web. 16 October 2013.
Leong, Tim. Super Graphic: A Visual Guide to the Comic Book Universe. San Francisco: Chronicle Books, 2013.
Manovich, Lev, Jeremy Douglass, & William Huber. “Understanding scanlation: how to read one million fan-translated manga pages.” Image & Narrative 12.1 (2011): 190-227.
Meskin, Aaron. “Defining Comics?” The Journal of Aesthetics and Art Criticism 65.4 (2007): 369-379.
Moretti, Franco. “GRAPHS, MAPS, TREE: Abstract Models for Literary History – 1.” New Left Review 24 (2003): 67-93.
Piper, Andrew. “Reading’s Refrain: From Bibliography to Topology.” English Literary History 80 (2013): 373-399.
Wershler, Darren, Kalervo Sinervo, & Shannon Tien. “A Network Archaeology of Unauthorized Comic Book Scans.” Amodern 2 (2013): n. pag. Web. 14 October 2013.
Woo, Benjamin. “‘Maybe they’ve mixed me up with Joe Sacco?’: Reportage, Autobiography, and the (non-)Touristic Gaze in Guy Delisle’s Graphic Travelogues.” New Narrative VI: Seeing is Believing. Unpublished conference paper. 2013. University of Toronto, Toronto, 2013.
The post Probe: Infographics for Graphic Lit appeared first on &.
]]>The post Boot camp: Discourse That Graphs its Discourse: “Fuck”-Clustering appeared first on &.
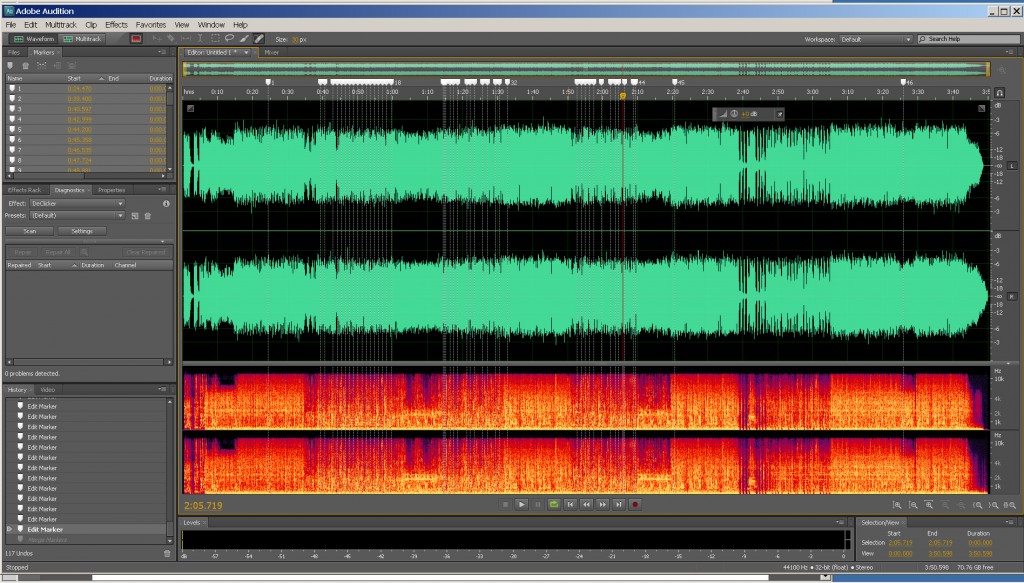
]]>Limp Bizkit’s “Hot Dog,” from Chocolate Starfish and the Hot Dog Flavored Water (2000), engages the same kind of satiric magnification as the supercut: a dense clustering of a discursive particle, in this case “fuck”. Andrew Piper calls this the defining character of discourse: “the cluster or concentration – Verdichtung…, a thickening of language” (384). However, the example of a content in which this character of discourse is exploited to an extreme illustrates the porousness between “content” and discursive analysis itself – especially when, in the case of “Hot Dog”, singer Fred Durst’s voice has occasion to boast a self-analysis: “If I say ‘fuck’ / two more times / that’s forty-six ‘fucks’ in this fucked-up rhyme” (2:05).
To analyze the self-analysand’s “analysong,” I played an mp3 version in the audio-editing program Adobe Audition, and placed a marker at each “fuck” (Fig. 1). This produced forty-six markers, meaning Durst’s count is numerically correct, but also revealing some parameters determining this number, and why such a numerical analysis as Durst’s may not function in the way we expect.
First, “fuck” defines not “just a word” (as the song calls it at 1:15) but the morpheme as it appears in a paradigm of affixed forms (plural –s, past-tense –ed). So, while we hear Durst say the word “fuck”, what we may think of as a “word” is not, grammatically, without an inaudible variable: “fuck*”.
Second, Durst’s count is non-recursive. “If I say ‘fuck’ / two more times, / that’s forty-six ‘fucks’ in this fucked-up rhyme” seems like a proposition whose “then” fulfills the two “fucks” conditioned by its “if” – but only until one hard-counts the instances to arrive at forty-six.
Third, similarly, Durst’s count assumes defined edges for the song that concretize it as such. Had the line been something like, “If you listen to this song, plus George Carlin’s ‘Seven Words You Can Never Say on the Radio’ / point-five more times / that’s at least 46 fucks that will have played in your proximate aural vicinity,” it would be non-self-enclosing.
But these revealed parameters only underline just how unimportant the exact count is. Isn’t it good enough to say that “46” in this context simply means “a lot”? “There’s a lot of F-bombs in this song,” is all the song’s 46n “fuck*” (where n is the number of listens) are already saying. The song’s explicit self-count only emphasizes what’s already formally evident by the cluster-driven hyperbole, a device whose efficacy revolves around producing degrees of recursively qualifiable emphasis rather than of quantifiable exactitude. Durst’s providing a number (the exactitude in this case is precisely what’s ridiculous) is just another multiplier in a series in which each element hyperbolizes the value of every other. All “fucks” are more than their sum when forty-six cluster in close proximity.
This much is to acknowledge the importance of frequency (“ratio” [Piper 379]) over simple number-value: Durst’s count means nothing without the immediate context of the song. But even here, saying that there are 46 “fucks” per 436 words (i.e. about one “fuck” for every ten words), or that there are almost two “fucks” for every second of song, still only says that there are “a whole lotta ‘fucks’.” The actually crucial assumed ratio, rather, is one that defines the cluster as emphasis at all. Emphatic/hyperbolic relative to what (beyond the song)? The key assumption – the key intuitive reading-at-a-distance – is what the song leaves implicit, its content an index to: that there is a lot of polite discourse in which “fuck” cannot be said (the implied specific target being mainstream radio airplay). In which case, if we can recognize this much on hearing, will the audiograph not do as well for us as its graphic image? And what of the fact that, by setting itself up as a cluster, “Hot Dog” makes itself attractive to cluster analysis, and sets itself up for a successful one?
Works Cited
Piper, Andrew. “Reading’s Refrain: From Bibliography to Topology.” English Literary History 80 (2013): 373-399. Web.
The post Boot camp: Discourse That Graphs its Discourse: “Fuck”-Clustering appeared first on &.
]]>The post Getting Graphic: Representing Representations in Humanities and Sciences appeared first on &.
]]>INTRODUCTION: GOOGLING GRAPHS
A Google search for the prompt “graphs are…” yields the following results: the best way to summarize data, visual representations of what, everywhere, often constructed from tables of information, and what of relationships. These fragmentary results illustrate the various approaches to graphs by different fields of research and institutional practices, as well as common conceptions regarding their purpose and value. In the article “Graphs, Maps, Trees,” Franco Moretti argues for a quantitative approach to illustrating literary trends; a shift from hermeneutic practices around individual texts to a quantitative analysis of literature (67). Introducing graphic displays of literary information exposes the field of literary studies to the questions aforementioned, not only is the question what the display shows but how and why its modality functions and what are the implications regarding power relations. What are the politics of graphing and how do they relate to the respective fields of humanities and sciences? Why does quantitative analysis in literature warrant such a “revolutionary” sentiment?
LITERARY LIKENESS: GRAPHS IN HUMANITIES
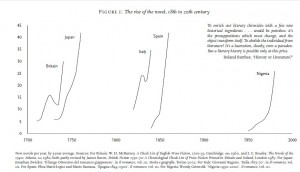
In “Graphs, Maps, Trees” Moretti employs a combination of line and bar graphs to illustrate his empirical analysis of the rise and fall of the novel. “Figure 1: The rise of the novel, 18th to 20th century” depicts increases in literary production in Britain, Japan, Italy, Spain, and Nigeria over 300 years with specific clustering effects (Moretti 69).
Moretti introduces the scholars whose data will provide the basis for the graph at the start of the section two, several lines before referencing Figure 1 in text and a page before the actual illustration (68-69). The contextualization then appears before the reader encounters the graph, and is repeated in the figure caption which also lists the sources, as is captured by Figure 1 above. This reiteration of source material provides an emphasis on validity and traditional scholarly methods, that by referencing accepted scholarly work the author’s own hypothesis or statement is by connection authorized as well. Joseph Bensman discusses the elitism of footnotes whereby one must cite another scholar who is “equal or higher in prestige” in order to gain legitimacy (450), the data sources for Moretti’s graph work similarly. The graph and its data sources connote power relations precluding contradictions and complexities of authorship and authority, as power exerts its forces in humanities research through the figure of the Author-god. Bensman states that “footnotes have important institutional, “political” and aesthetic functions” (443); similarly these functions are also influenced by and through the graphs presented. The aesthetics as well as the political functions assert the graph’s authoritative dominance, Moretti uses a quote from lauded scholar Roland Barthes to champion the removal of the subjective from his analysis and thus this quote corroborates the quantitative analysis methodology (69).
BATTLEDOME: SCIENCE VS. ARTS
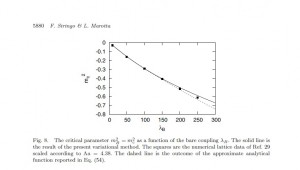
Moretti states that “graphs are not models; they are not simplified versions of a theoretical structure in the way maps and (especially) evolutionary trees” are (72): graphs are relations. Moretti both supports and contradicts this thesis with his own graphs; although they do illustrate relations between the numbers of books produced and the books’ locations, the accuracy as well as the reliance on traditional scholarly validation subverts the radical claims. Cosma Shalizi criticizes Moretti’s methods, arguing that Moretti should have analysed the data himself and mathematically calculated the probabilities for clustering occurrences and errors (118). This argument represents the burgeoning issue of transplanting quantitative analysis methods from science based research to literary practices. If Moretti’s data sources are proven wrong, or if his methods are found faulty then his argument for literary quantitative analysis can be refuted. An example of traditional scientific graphs is found in Figure 2, taken from a scholarly paper on Higgs modelling, a scientific phenomena which, as the paper attempts to prove, can be adequately imagined through specific microscopic structures called crystal lattices (Siringo 5880).
Regardless of its scientific meaning, the graph connotes several key statements which illustrate the shortcomings and successes of Moretti’s quantitative analysis. The line graph uses the caption to describe the phenomena and its graphic representation, it does not refer to outside sources for validity of previous results. Secondly, error is factored into the illustration by the size of the data points as well as the predicted function (the dashed line). By encrypting the graph with secondary information that is accessible through the primary study, the scientific graph elucidates the conceptualization process, turning to transparency for validation and allowing the reader to deduce its value rather than relying purely on precedent research.
Yet the scientific graph reinforces power relations by assuming the reader is adhering to the conventions of reading graphs, for example understanding that larger data points mean more possible error. Audience influences the output, the graph and caption describe sets of social relations and systems, discursive sets in a Foucaultian sense. In Andrew Piper’s article “Reading’s Refrain: From Bibliography to Topology” he suggests literary topology, which analyses the text not through hermeneutics but by assigning values to the lexicographic elements and represents them visually, signals an inspection of places in which literature intersects with other types of social strata and discursive readings (394). The inability to escape power relations through graphs, both in the humanities and sciences, highlights the connection between the process of academic research, Authorship (as in the panoptic) and social rules. Moretti hypothesizes that “quantification poses the problem… and form offers the solution” (86) which can be compared to concept of literary topology. Literary topology, as Piper illustrates in the Goethe graph, performs a similar function to work of Moretti’s graph, preferring quantitative data to the interpretative techniques (385), exhibiting shifting power relations between Author and reader that allow the reader more authority. This also is present in the scientific article, as form is contextualized later in the Higgs paper, when the discussion reveals the equation for the line graph and its derivation, evoking specific associations to fields of study and popularized theories. Therefore the graph summarizes the data while reflecting the environment in which it was constructed, physically from the digital program which produces the equation to the politics of theory behind the illustration.
HYBRIDIZATION STATION
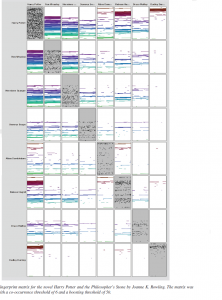
Moretti’s graph attempts to convey more than one set of data results, i.e. more than one line segment. The results represent a comparison between countries and publication numbers, yet temporally they do not provide a cohesive linearity and further inference on the part of the reader is required. The article “Fingerprint Matrices: Uncovering the dynamics of social networks in prose literature” examines inter-character relations and compares these relations between novels, such as The Queen’s Tiara by Carl Jonas Love Almquist and J.K. Rowling’s Harry Potter and the Philospher’s Stone. Although the articles’ subject matter is slightly different, both propagate quantitative analysis of relations as the main analytic form; the graphs included illustrate the shift in methodologies and as such Piper’s concept that topology is the analysis of ratio rather than difference (379).
“Fingerprint Matrices” presents material in a radically different graphic form than in the Moretti article, it uses matrix graphs to visual social networks. Ratio is “knowledge of the relational and the scalar, the co-presence of difference” (Piper 382); this is witnessed in the Harry Potter matrix graph which highlights the relationships between characters as well as their placement within the novel and subsequently their importance in the plot. With multiple goals the graphing structures must change as the two dimensional line graph used by Moretti is no longer able to display the information, and thus fingerprint matrices (as seen in Figure 3) are created instead (Oelke 372), becoming visualizations of text.
Alongside the fingerprint matrices are the researcher’s methodologies and background sections. The latter section (which cites Moretti) again displays the typical academic posturing, however it is more concise than previous essays examined. The methodologies section describes data collection, processing and graphic output, something which is markedly absent from Moretti’s section two-Figure 1 relationship. Piper states “when we read topologically we are reading our way through language’s historical entanglements,” (Piper 378) therefore the fingerprint matrices not only examine the repetition of Harry Potter characters, but the changes in research illustrations and performs a conjoining of theory and criticism (Piper 389). By producing a methodology whereby all its mechanisms become pellucid the validity of traditional research in humanities changes. No longer do the citations hold substantial authoritative power, but the empirical data and its representations are available for the reader to evaluate the efficacy of the results. Therefore the modifications of the mechanism and its display alter the researcher’s writing as well as the traditional outline of literary articles, which now use methodology and discussion section headings.
Conversely, the opposite argument can be made, that the articles modify the methods; these texts are located in digital domains. All three graphs outputs are digitally rendered, the scientific graph and fingerprint matrices both disclose the graphing procedures which use programs to sift and organize data. By analyzing the pixilation of the lines and the familiar settings of LaTEX, Moretti’s graphappe ars to be constructed via computer program. Digital graphs now require the reader to examine new elements, such as the efficiency of graphing programs or the image resolution in order to discern veracity and value. A further discursive set creates the authoritative relations between journals and readers, another power relation that highlights the function of graphs in scholarship. Currently these articles are available online through Science Direct and the Arts and Humanities Databases, which limits use to university affiliations yet still disseminates the material to a larger audience than through paper production. As quantitative analysis opens more possible readings to literature, the ‘entanglements’ of objects grow; the graphs emphasize the rules of literary production and character relations, rather than the meaning and the objects themselves, reflecting the increased multiplicity of articles and journals available. This perhaps addresses Piper’s question “what does it mean to read electronically?” (373); digital reading utilizes electronic resources and thus makes conscious our academic practices of reading in humanities research. Ultimately more questions remain, those still left unanswered include: how do these academic objects move through popular culture? Where are the intersections between fields of research in regards to graphing techniques? Does digital production of methods alter the function of research?
Works Cited
Bensman, Joseph. “The Aesthetics and Politics of Footnoting.” International Journal of Culture, Politics, and Society 1.3 (1988): 443-470. Web.
Munroe, Randall. “Tall Infographics.” XKCD.com. October 4, 2013. Web. October 19, 2013.
Moretti, Franco. “Graphs, Maps, Trees.” New Left Review 24 (Nov-Dec 2003): 67-913 Web.
Oelke, D., D. Kokkinakis and D.A. Keim. “Fingerprint Matrices: Uncovering the dynamics of social networks in prose literature.” Eurographics Conference on Visualization 32.3. Ed. B. Preim, P. Rheingans and H. Theisel. Oxford: Blackwell Publishing, 2013. Web.
Piper, Andrew. “Reading’s Refrain: From Bibliography to Topology.” English Literary History 80 (2013): 373-399. Web.
Shalizi, Cosma. “Graphs, Trees, Materialism, Fishing.” Reading Graphs, Map, Trees: Responses to Franco Moretti. Ed. Jonathan Goodwin and John Holbo. Anderson: Parlor Press, 2011. 115-139. Web.
Siringo, Fabio and Luca Marotta. “Nonperturbative Effective Model for the Higgs Sector of the Standard Model.” International Journal of Modern Physics A 25.32 (2010): 5865-5884. Web.
The post Getting Graphic: Representing Representations in Humanities and Sciences appeared first on &.
]]>The post “Reality is not made of statements,” But Stories Are. appeared first on &.
]]>The fairy tale, then, does not attempt to explicate or delineate reality so much as to escape it, and despite being a massive break from Harman’s ontological and literary interest in Lovecraft’s writings, folklore nevertheless exemplifies Harman’s phenomenological gap, most obviously the “horizontal gap,” or what he describes as “the cubist gap between an accessible object and its gratuitous amassing of numerous palpable surfaces” (31). Individual utterances of a specific tale are what define the largely and historically oral tradition of folklore. Each tale’s variant, whether it be that of words or narrative details, becomes the cubist flag flapping in the wind (Harman 30), and his argument that “what we end up with are the truly pivotal qualities of the thing” in Lovecraft’s literary style and phenomenological perspective are exactly the methodologies inherent in folklore studies (31), which typically examines a particular folktale given its various and varying iterations across – and consequent incorporations into – time and space (i.e., its periodization and nationalization, its material distribution via literary and oral renditions in public and private spaces, etc.). In fact, János Honti proposed in 1939 that the fairytale is “a kind of cookie-cutter Platonic form or model which manifested itself through multiple existence [sic]” (qtd. in Dundes 195). This seems remarkably similar to Harman’s example of the flag as an ontological object, where “the specific qualities of the flag encountered at any given moment do not hide the flag as a unitary object, but exist as something extra, encrusted on its surface” and ostensibly expendable in our conception of the object (30; emphasis added). Honti’s notion that a tale-type is a cohesive object with varying manifestations results in the same gap between the accessible object (in this case, the folktale) and its “gratuitous amassing of numerous palpable surfaces” (Harman 30), and moreover informs the classification process of folkloric indexes, which attribute specific iterations of stories to a larger archetypal narrative of the folktale in question. What becomes tautological in Harman’s philosophically inclined argumentation is in fact folklore’s modus operandi. One significant distinction arises: to continue with Harman’s rhetoric, folklorists use each cubist surface or tale’s point of entry for juxtaposition; repetition is not tautological here, but structural, allowing folklorists to recognize specific instances of a larger archetypal tale structure. So while for Harman the “banality” of statements has grave consequences for philosophical theses (14), what his article frames as an issue of discursive relativism (reality is not made of statements) is actually what allows folklorists to identify a tale’s integral constituents, and propose some reality regarding a fairy tale’s identity. In other words, iterations’ variations (within Harman’s argument, a paraphrased statement) reveal an archetypal structure that defines a particular tale and what can be categorized as such a tale, proposing some reality-value regarding a story’s identity rather than revealing, as Harman and Zizek argue paraphrase does, a statement’s removal from reality.
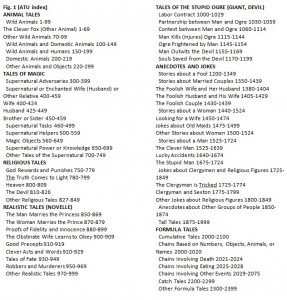
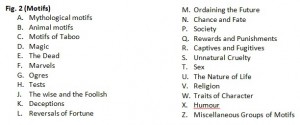
So I began with the premise that the fairy tale genre repudiates reality, and yet have concluded that it still makes a truth claim. In fact, Antti Aarne (1910), Stith Thompson (1928, 1961), and later Hans-Jörg Uther (2004), have created a classification system (herein abbreviated to ATU index, tale type, etc.), which is widely acknowledged as an invaluable source in folklore, “an international sine qua non among bona fide folklorists” and authority on what constitutes a specific tale (Dundes 195). In the ATU index, a folk tale is given a code based on numbers and letters. The number corresponds to types of tales, and the letter to tale motifs (see figs. 1 and 2).
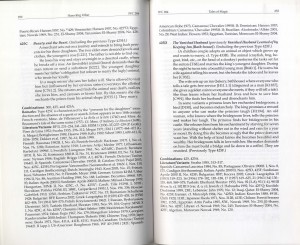
Thus “Beauty and the Beast” is ATU 425C (fig. 3), introducing the motif of taboo (in the particular case of 425C, the Beauty figure “overstays the allotted time” when visiting her family [Uther et. al 252], resulting in the Beast figure’s near demise) to the Search for the Lost Husband tale type. This is distinguished from its mythological predecessor, “Cupid and Psyche,” which is typically identified as straddling 425A (“The Animal as Bridegroom”) and 425 B (“Son of the Witch”). This organization inevitably raises questions: why is “Beauty and the Beast” identified as 425C, whose ATU motif assignment deals with taboo, when “The Animal as Bridegroom” seems to be the larger focus of the tale? When it comes to the ATU index, framing mechanisms emphasize the object as somehow transcendent, yet the mechanism itself is highly mediated.
Perhaps some awareness is necessary of how, as Foucault warns us, “divisions[,]” in this case those between tale types, “are always themselves reflexive categories, principles of classification, normative rules and institutionalized types; they are, in turn, facts of discourse which merit analysis alongside other facts, which certainly have complex relations with them, but do not have intrinsic characteristics that are autonomous and universally recognizable” (303). But the problem can be exceedingly complex, especially when such awareness makes evident just how political categorization can be. For example, is “Cupid and Psyche” 425A, 425B, or should it have its own category? What influences the process of categorization (hint: in the overall category of ATU 425, Search for the Lost Husband, ideologically encoded language and titling which denies female agency and emphasizes patriarchal roles), and what are the limits of these boundaries and their impacts? What does choosing one motif over another as the vital motif imply? If “Beauty and the Beast” is in fact determined by the taboo of Beauty “[breaking] the prohibition of staying home too long” (Thompson et. al 252), the sociopolitical implications of a tale defined by a woman failing to return to the beast who possesses her due to a failed transaction (specifically, her father’s failed transaction with the Beast) is certainly telling. In fact, even the Greenwood Encyclopedia of Folktales and Fairy Tales argues that “[u]nlike the Cupid and Psyche tale… where the emphasis is on the breaking of the taboo that forbids the young woman to look at her husband… ‘Beauty and the Beast’ emphasizes the animal qualities of the groom and his ultimate transformation from a monster into a human being” (106), and yet it is still identified under the “taboo” motif.
Here is where Harman’s “vertical gap” occurs, the one “between unknowable objects and their tangible qualities” (31). A fairy tale is language, words spoken out of mouths or script read on a page. Their tangibility is undeniable, but their categorization, the knowledge of what any specific tale is, remains less certain. Organized by tale type and subcategorized by motif, the ATU index highlights folklore as a medium of repetition, paraphrase and slight transformation. Thus no story will remain identical to its previous iteration, and the very notion of a tale independent from its type confuses and befuddles when considering folklore from within the context of the ATU indexical system. Is “Beauty and the Beast” a distinct tale type, where each iteration or variant is a single unit or cubist facet of its expression, or is it a less certain and more troubling distinction between tales that are, by ATU tale-type definition, different and inherently so? In the instance of ATU classification, a tale’s tangible qualities, a specific variant’s pronunciations, names, regional references, diction, cultural mores, etc. often reveal gaps between what can be known (the tale I have accessed) and the “unknowable object” (Harman 31), or the tale type as a consistent unit or ontological object. However, while I establish a connection between the ATU index and Harman’s ontological “‘vertical’ gap,” it is important to note that Harman’s gap is due to the evasion of signification, whereas the ATU index’s “vertical gap” is due more to an excess of signifiers, of diegetic elements and narrative motifs that expand potential forms of categorization rather than completely evade them. And this is where and how discourse emerges in the ATU indexical system: with an excess of signifiers, discourse becomes the inevitable filter for the database.
Having reached the end of my probe, I realize I have argued that fairy tales are antithetical to reality, make truth-claims regarding a certain kind of reality (regarding the stability of an archetypal tale and the collusive politics of categorizing, naming and consolidating narrative details), and are ultimately undermined by this gesture due to excessive potential signifiers and consequent discursive moderation. And so I, like Lovecraft, find I am unable to directly talk about a thing, and instead must move about it and probe it from different angles while ultimately unable to coalesce these details. Folklore is, like Lovecraft’s writing, “disturbingly alert to the background that eludes the determinacy of every utterance, to the point that [both] invest[…] a great deal of energy in undercutting [their] own statements” (Harman 28). However, I’m comforted by the fact that folklore also struggles with this, and that its rich history of mining tales for traces and motifs that can help identify a story have increasingly battled with the dissatisfaction over motivated categorizations. As Harman argues, “objects are what the classical tradition called substantial forms, inhabiting a mezzanine level of the cosmos, and can be paraphrased neither as a meaning for some observer nor as the dangling product of some genetic-environmental backstory” (253). The ATU index attempts to both identify a “genetic-environmental backstory” (the archetype) as well as provide meaning (“Beauty and the Beast,” according to ATU classification and prioritization, is a story about a woman who fails to return to her husband, as opposed to a story about a woman who becomes an expendable transaction being forced to return to her place of imprisonment). Fairy tales are by definition fiction, but what about their forms of classification? Is an archetype a fact, or a convenient, if not necessary, fiction? Should the methodologies and scholarly paradigms used to study a fairy tale correct their relationship with reality, or emulate what they examine? Is this a matter of preference, or an ethical issue, given the seeming customary (and increasingly moreso) coupling of folklore and ideology? So while Harman argues that “we can only support objects” (253), I would like to emphasize that we must first examine those objects’ relations to us, and in cases like folklore we must also question whether something is (easily) determinable as a cohesive object, and evaluate whether Harman’s phenomenological gaps à la Lovecraft produce valuable complications of just how “we produce our own real objects in the midst of [perception and context]” and the knowledge bases these productions secure (260).
Works Cited
Ashliman, D.L., ed. “Beauty and the Beast: Folktales of Type 425C.” Folktexts: A library of folktales, folklore, fairy tales, and mythology. University of Pittsburgh, 25 June 2009. Web.
Dundes, Alan. “The Motif-Index and the Tale Type Index: A Critique.” Journal of Folklore Research 34.3 (Sep. – Dec. 1997): 195-202.
Foucault, Michel. Aesthetics, Method, and Epistemology. Ed. James D. Faubion. Trans. Robert Hurly et. al. New York: The Press, 1998.
Harman, Graham. Weird Realism: Lovecraft and Philosophy. Washington: Zero Books, 2011.
Swain, Virginia E. “Beauty and the Beast.” The Greenwood Encyclopedia of Folktales and Fairy Tales. Volume 1: A-F. Ed. Donald Haase. Westport, CT: Greenwood Press, 2008 ed.
Thompson, Stith. The Folktale. New York: Holt, Rinehart and Winston, 1946.
Uther, Hans-Jörg. The types of international folktales: A classification and bibliography, based on the system of Antti Aarne and Stith Thompson. Helsinki: Suomalainen Tiedeakatemia, Academia Scientiarum Fennica, 2004.
The post “Reality is not made of statements,” But Stories Are. appeared first on &.
]]>The post Painting by Viscosities appeared first on &.
]]>While it does promote a standard appearance for its models by featuring its own painting team ‘Eavy Metal on the boxes of its models and in the issues of its magazine, White Dwarf, GW is acutely aware that this is not enough. Given that fewer people know how to paint than play strategy games, and that GW’s “curb appeal” is contingent upon its players having well painted models, it is necessary for GW to automate people into producing paint jobs that they will find adequate. Because GW needs to sell a lot of models to make a profit, it has built a game system which requires between 100 and 300 models to play. Given that these models are expected to be painted, it is in GW best interest to develop and share techniques that enable speed painting. Simply put, the faster you can finish painting your models, the faster you can consider buying more. It does so in a two-pronged fashion, it promotes a technique of painting through its in-store customer service which works in tandem with a set of acrylics to produce what it calls the Citadel Paint System. This probe will explore the ways in which the paints have agency, the reasons for why they do, and what they teach us.
To do so, I turn to Ian Bogost’s philosophical carpenter who practices Object Oriented Ontology (OOO). He explains that she “creates a machine that tries to replicate the unit operation of another’s experience. … [T]he alien phenomenologist’s carpentry seeks to capture and characterize an experience it can never fully understand, offering a rendering satisfactory enough to allow the artifact’s operator to gain some insight into an alien thing’s experience” (100). Essentially, Bogost’s argument is that there are multiple ways of expressing things and that these modes of expression shape what can be expressed. This carpenter is capable of expressing ideas outside of language with the use of her craft’s materials. This matters because she is able to produce specific kinds of knowledge, which would otherwise escape the philosopher afforded by the materials of the essay. For his and our benefit, Bogost cites Bruno Latour, “Standing by what is written on a sheet of paper alone is a risky trade. However this trade is no more miraculous than that of the painter, the seaman, the tightrope walker, or the banker” Knowledge, he concludes, “does not exist. . . . Despite all claims to the contrary, crafts hold the key to knowledge” (110). As a painter and craftsman then, I would like to explain why people do not naturally paint miniatures well and what kinds of knowledge they receive from the materiality of Citadel Paints.
In order to paint a miniature, one must first prime it with spray paint. Spray paint can adhere to the plastic, resin and pewter that the models are made of, and can itself be adhered to by acrylic. Because the spray paint is usually a not meant to colour, GW recommends base coating. The Base paint “Caledor Sky” is one of the many available base coat colors. These paints are meant to go on the model first because they cover evenly and thickly, hiding the underlying primer of the model. The reason these paints can do this is because they have a very high pigment density. This high density lends a chalky look to the paint and will rarely work as a final color. However, this is not the only problem, if one were to quit painting after applying a Base paint to every different part of a model, something would look wrong.
It turns out that the models are at a scale shadows and highlights do not appear natural with normal levels of lighting. The recesses and edges of the miniature need to be accentuated. It also turns out that manually painting changes in light is very difficult. Miniatures are small to begin with, but their recesses and edges are measured in half millimeters. To freehand paint these would require tremendous skill with even the finest of brushes. What is more, it is not obvious where shadows live and what receives the most light. In order to create the effects of shadow without requiring years of training steady hands and accurate eyes, Citadel offers Shade paints, such as “Coelia Greenshade.” These have very low levels of pigment in a particularly viscous acrylic. The increased viscosity of the acrylic makes is so that the paint will pool in crevices due to its surface tension and the phenomenon of capillary action. Because of its low pigment density, what little amounts that do not pool, barely show. What this means for the miniature painter is that by slathering a Shade to a model, all of the recesses will receive paint while all of the edges and tips will remain brightly coloured. The end result is a shaded model produced with technique, but not trained skill. What is more, the viscous acrylic returns a shine to the model, repairing the previous chalkiness. It is here that GW has communicated how shadows behave and it has done so with an acrylic machine. It is not a one-to-one correlation, but an expression with certain abstraction, which is nevertheless accurate to a degree. Shadows pool, they are like fluids which form capillary action and flow into the smallest crevices with alacrity.
To produce highlights, the opposite of shadows, Citadel offers Dry paints such as “Praxeti White.” These are extremely high pigment paints with a barely fluid acrylic. When a brush is dipped in these, paint does not come off normally. The pigment is dried onto the bristles and will only come off if a pigment-covered bristle scrapes against a sharp surface. To highlight a model then, it is only a matter of roughly and briskly moving a paintbrush covered in a brightly coloured Dry paint over a model. Here again, we learn how light behaves by experiences how paint behaves. GW has made it so that in a coat of spray paint, a base coat, a shade and dry brush, applied haphazardly to a miniature design with this process in mind, produces an attractive model. The process of painting is Taylorised allowing unskilled labour to mass produce painted models. Despite this alienating mode of unpaid labour, which replaces artistry with machines in order to stabilize a network of demand, we can treat this machine as an object which expresses objectness and learn about ourselves.
Our visual senses are keenly aware of shadows and highlights, and that their accentuation in small objects makes them look more meaningful. Graham Harman writes,
“Real objects exist in themselves, regardless of whether anything else registers their existence. But content is always content for some entity. Normally we do not notice this in our own lives, since we take ourselves for granted and assume that merely by opening our eyes we see everything exactly as it is. We are normally unaware of the contortions imposed on the things by our own limitations and even our own gifts. For this reason, we do not usually experience the tension between ourselves and our experiences, any more than we usually notice the tension between an apple and its real or sensual qualities. For this to happen, we need to endure a breakdown of the usual situation in which perceptions and meanings simply lie before us as obvious facts…” (258).
When I first began painting, I did not have the time or money to paint my models the ways GW proposes. I used dollar store acrylics and dollar store brushes. My models were alien in appearance as they appeared nothing like I imagined they would. They were the wrong texture, tone, and served as a reminder of my own inadequacies as a painter. Despite this, I happily played with them until I experimented with the Citadel Paint System. The results of my labour with these tailored materials were so far beyond what I had been producing that I eventually had to sell my early models for they embarrassed me too much. In exchange for freedom of hand and mind, I better understood how light behaves, how I take it for granted and why, where, and when it changes colours.
Works Cited:
Bogost, Ian. “Carpentry.” Alien Phenomenology, or, What It’s Like to Be a Thing.Posthumanities. Minneapolis: University of Minnesota Press, 2012. Print. 85–111.
Harman, Graham. Selections from Weird Realism: Lovecraft and Philosophy. Winchester/Washington: Zero Books, 2012.
The post Painting by Viscosities appeared first on &.
]]>The post Writing About Objects: Boot Camp The Perfect City in Sim City 3000 appeared first on &.
]]>Oscala, an architecture student at the time, spent 18 months planning his creation on paper, sketching building plans and crunching numbers to ensure that he would have the maximum people in his city. His city, Magnasanti, is constricted to towering blocks of apartments and office buildings. The people residing in Magnasanti work solely in their block. They do not need to travel, therefore the city contains no roads to maximize space. What is the most impressive about it this city is that Magnasanti has zero abandoned buildings, 100% of all zoned structures are historical, there is zero water pollution, zero congestion, no crimes, and all basic needs can be found within your “block” community (Youtube – Magnasanti Tour).
In opposition to these pros, what is terrifying about this city is that Oscala calculated that with no education, little healthcare, infrastructure, and little space to organize protests, or to escape the city, the inhabitants are bound to obey the governing laws of the state police. As a result, life expectancy does not exceed 50 years. In an interview with Vice, Oscala states,
“Technically, no one is leaving or coming into the city. Population growth is stagnant….There are a lot of other problems in the city hidden under the illusion of order and greatness: Suffocating air pollution, high unemployment, no fire stations, schools, or hospitals, a regimented lifestyle….The ironic thing about it is that the Sims in Magnasanti tolerate it. They don’t rebel, or cause revolutions and social chaos…They have all been successfully dumbed down, sickened to poor health, enslaved and mind-controlled just enough to keep this system going for thousands of years. 50,000 to be exact. They are all imprisoned in space and time.” (Vice Interview).
There are many reasons why Oscala created Magnasanti the way he did. To Oscala, Sim City 300 is not just a game, “It has evolved to become a tool or medium for self-expression. Sim City instead allows one to exercise the imagination to create, and express.” (Vice Interview). Oscala feels the same way about his city as Ralph Eubanks expresses that he feels about writing, when asked why he writes. “There is something both emotionally satisfying about it and something that is very physically satisfying when you finally see your work when it comes out in a finished book or when you see the pages at the end of the say.” (Bogost, 86). Like Bogost, Oscala is enjoying the “natural ability to manipulate systems that themselves are mere accidents of human discovery and exploitation.” (Bogost, 87). This is exactly what Oscala means when he states, “I wanted to magnify the unbelievably sick ambitions of egotistical political dictators, ruling elites and downright insane architects, urban planners, and social engineers.” (Vice Interview). He uses the game to sculpt his personal views into a virtual reality as made possible by the Sim creators.
It is my belief that Oscala’s city, as well as the game itself, is a good example of Actor Network Theory, as it proves that the “making of objects ha[ve] spatial implications and that spaces are not self-evident and singular, but that there are multiple forms of spatiality.” (Law, 92). The game itself is made of networks that relate to each other and have different consequences depending on what the player choses to do to the city.
Works Cited:
Bogost, Ian. “Carpentry.” Alien Phenomenology, or What It’s Like to Be a Thing. Posthumanities. Minneapolis: University of Minnesota Press, 2012. Print 85-111.
Law, John. “Objects and Spaces.” Theory, Culture & Society 19.5/6 (2002): 91-105
“Sim City 3000: Magnasanti Tour.” YouTube. YouTube, 19 Mar. 2013. Web. 06 Oct. 2013.
“SIMCITY 3000 – MAGNASANTI – 6 MILLION – ABSOLUTE MAXIMUM.flv.” YouTube. YouTube, 25 July 2010. Web. 06 Oct. 2013.
“The Totalitarian Buddhist Who Beat Sim City.” Vice. N.p., n.d. Web. 06 Oct. 2013.
The post Writing About Objects: Boot Camp The Perfect City in Sim City 3000 appeared first on &.
]]>The post Show Facts, Hide Facts: Applying Latour to Database Structures appeared first on &.
]]>In view of our reading of Latour’s rearticulation of the assumptions informing the concepts of “facts” and “values” into new terms that recognize the processual cyclicity of institutionalizing always-debatable uncertainties into useful certainties, and in view of Alice Munro’s having just been awarded the Nobel Prize in Literature, an article entitled “Denied Nobel Prize Yet Again, Margaret Atwood Plots Post-Apocalyptic Revenge” seems timely. The article appears on the website Newslo, which boasts (with apropos unabashedness with respect to facticity) the title of “The First Ever Hybrid New/Satire Platform!” The title captures accurately, however, the Newslo site’s hallmark article-viewing functionality: a toggle for “Show Facts” and “Hide Facts” foots every article. Activating the former button highlights the portion of the article that has been institutionalized to the realm of what we would previously have called facticity; re-negating these highlights (back to the article’s default appearance) returns smoothly and non-libelously the factual portions into formal homogeneity with the sensationalist satirical tabloid remainder. “Just Enough News,” runs the site’s motto, which is just as well an ironic motto for news in general nowadays: there’s too much news, and yet never enough “(f)actual” news in that news (and never enough fiction in our “fiction“). How can we better define that “just enough” (with pun on “just”)? We need what Latour proposes: a better “power to take into account” (Facebook account or otherwise): we need to evolve our filter-feeders.
Indeed, Newslo’s filtering system typifies the related problem of facticity in regard to digital public spheres that we discussed both yesterday in relation to a Quebec provincial voting commercial, which we argued exemplified the complex relations governing the way in which the mob rule of social media gets billed as democracy via that social media itself, as well as last month in relation to our discussion of print newspapers versus databased newspapers and the personalized newsfeed. “Filter bubbles,” Ted Talker Eli Pariser calls it, this Internet censorship phenomenon in which our bias towards our own politics of interest can actually work against our own interests – especially when, as Pariser relates, Facebook one day decides to run an algorithm (just for “you,” i.e. for you) that converts all your visible news into whatever your Good News happens to be. While the talk is scarcely worth skimming beyond what I am graciously filtering for you, Pariser does end up proposing that databases like Google adopt what amounts to an extension of the logic of Newslo’s system: namely, including among our “sort by” options checkboxes for things like “Relevant”, “Important”, “Uncomfortable”, “Challenging”, and “Other Points of View”. The metaphysics of presence points to an obvious problem with this system, or rather with the utopian version of it (a database will never represent what is truly Other to it – we, and even Google, simply cannot know how “Other Points of View” is itself being filtered; and is a comfortable way to find the “uncomfortable” possible?), but nevertheless the gesture seems valuable, and maybe even represents a crude attempt at doing for the database what John Law proposes scholars do for research in general: making explicit to our readers the always-messy contingency of that research. Perhaps databases should have a “messy” filter (kind of like the trope of the button which you’re told never to press because no one knows what it does), which when you press it simply puts everything through a glitch-randomizer and fucks everything up.
It is such mess, though, that Latour likewise encourages as the one of two requirements of his proposed initial phase for institutionalization (what in the old language we would call fact-making), the phase of taking into account all of the entities that we have at our disposal to debate for institutionalization candidacy: namely, the requirement of perplexity, a “provocation (in the etymological sense of ‘production of voices’)” in which “the number of candidate entities must not be arbitrarily reduced in the interests of facility or convenience” (110). Its corollary is the requirement of relevance – considering the relevance of the various stakeholding voices to perplex what is being, by debate, perplexed. This latter somewhat relates to Pariser’s proposed (re)search filter category, but more to that mark is the requirement of hierarchization in Latour’s second of the two institutionalization phases, arranging in rank order. For, Pariser’s category of “Relevance” (and rather than simply pertaining to the already-familiar category of “sort by relevance” vis-a-vis search terms) comes in critical response to Mark Zuckerburg’s cited remark that “[a] squirrel dying in front of your house may be more relevant to your interests right now than people dying in Africa.” Pariser’s point is that, if newsfeeds or other search results are ever to even approach something more like the impossible ideal of information democracy to which popular media discourse so often articulates them, then the squirrel pictures that come up in our newsfeeds should perhaps not be placed at the same level of relevance as humanitarian crises in what Latour calls society’s “hierarchy of values” (107) (which also, notably, functions by a “[r]equirement of publicity” [111, emphasis added]).
The comparison to be made, then, is between the (in the old terms) “fact-evaluation” process that Latour proposes for constitutional democratic government, and the way in which information is similarly filtered to and filterable by the public of such democracies within their digital news and (re)search platforms. Latour’s proposed process begins with perplexity and relevance – in other words, the collection of search results (the terms – relevance – and their results – initially, perplexity) that then, in the second part of the process, the move toward actual instutionalization (“closure”), must get hierarchized accordingly in terms of their hierarchical ethical valuation. In sum, it would seem that, in extension to Newslo’s and Pariser’s unique filtration systems, and indeed as a corollary component to the type of public network resultant of precisely the kind of (public sector) debate apparatus that Latour proposes, our new digital filtration systems should involve not just parameters like “Show Facts” and “Relevant” but precisely such a process as Latour’s, with its unique re-articulation of “facts” and “values” into less contradictory categories. Then a system such as Newslo’s could only constitute absurdity insofar as “facts” would no longer be a category for filtration. But more importantly, because the relative contingencies of what we used to call “facts” (and get mixed up with “values”), and the (traces of the) process by which they became such, might be explicitly built into all our articles and newsfeeds and other search databases. That is, the equivalent of “Show facts”, for example, would show (by a kind of markup, perhaps) what had been successfully put through Latour’s process of institutionalization.
Otherwise, Margaret Atwood might still be in the running, according to her own personalized fantasy newsfeed. For the division between “facts” and “values” (where the latter equals the explicitly skewed satire in Newslo’s articles) is never so clear as Newslo makes it. Hence the need and use for Latour’s proposed new articulations.
Works Cited
Latour, Bruno. “A New Separation of Powers.” Politics of Nature: How to bring the Sciences into Democracy. Cambridge: Harvard University Press, 2004. 91-127. Print
Law, John. “Making a Mess with Method.” Lancaster: The Centre for Science Studies, Lancaster University, 2003.
http://www.comp.lancs.ac.uk/sociology/papers/Law-Making-a-Mess-with-Method.pdf
The post Show Facts, Hide Facts: Applying Latour to Database Structures appeared first on &.
]]>The post Carpentry, Networks, and Munchkin Cthulhu appeared first on &.
]]>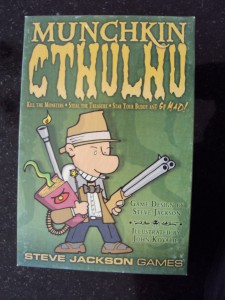
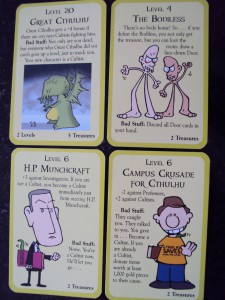
Munchkin Cthulhu is a game designed by Steve Jackson and illustrated by John Kovalic. The game is based on the works of H.P. Lovecraft. Ian Bogost writes, “One form of carpentry involves constructing artifacts that illustrate the perspective of objects” (109), so if Lovecraft’s written works can be considered the “object,” then the card game could be seen as the artifact constructed in relation to it. Not everyone who plays Munchkin Cthulhu has read Lovecraft, but the great thing is one does not have to know Lovecraft to play the game. Yet, if they ever do decide to read Lovecraft, the connection between the game and his writing takes on significance as how many authors have a monster named Cthulhu? Bogost says at “Urustar, designers recast and condense hundreds of pages of my books into playable pixel art” (110), and Steve Jackson performs the same sort of “carpentry” with Lovecraft in transforming his work into a playable game.
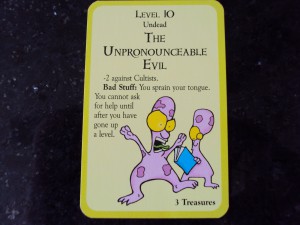
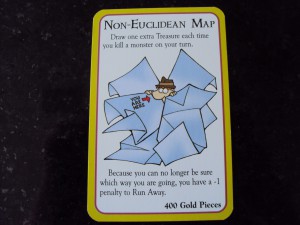
Munchkin Cthulhu has its own network; it has rules, a die, cards, and players. The rules state you can have between three to six players and everyone needs ten tokens. There are door cards, and treasure cards. Each player starts with two door and two treasure cards. When playing the game, one begins their turn by “opening a door” i.e. you pick a door card and the card dictates what you do. You can end up fighting a monster, they range in level from on to twenty. Some examples:
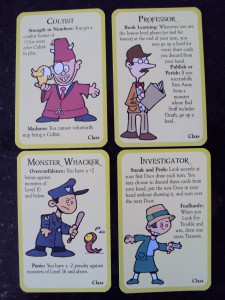
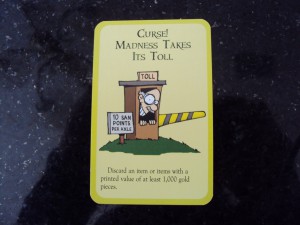
You can also pick a class card. If you choose to accept a class (all players start with “no class” – to the endless amusement of the game designers who “never get tired of that joke” (Game Rules 1)), some of your choices are:
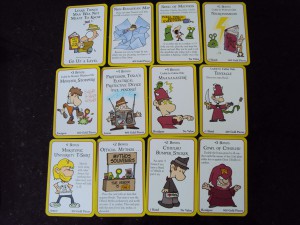
If you pull a class card first on your turn, you have the choice to pick another card or, ”look for trouble” – i.e. pull another door card, or fight a monster you have in your hand (you can hold up to five cards). The goal of the game is to be the first to reach level 10. You go up levels by beating monsters (mainly) or by using “Go up a level” cards. Your strength in battle is determined by your existing level (all players start at level 1), and added to your level is whatever treasure you have in play that gives you a bonus you can add to your level (these are displayed in front of you). Some examples of treasure:
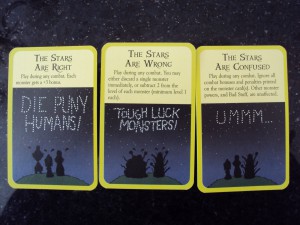
Thus, if you are a level one without any aid in the form of tentacles, cowls, or bumper stickers (among other interesting things), and you draw a level 10 monster, death is imminent. However, you have choices at this point. You can flee – which works only if you roll a 5 or 6, or you can ask for help from another player(s) (that is if they are willing to help you). If all players are level 1 with no help, then you take your chances and flee otherwise you all die. If the other player is in a position to help you, and is willing to, (because if you win the battle you gain a level and are that much closer to winning), they usually (at least in my family) demand treasure in exchange. Asking for help does not work when you are a level 9 and need to kill the monster for the win (you must kill a monster to win, you cannot use a “Go up a level card”). At this point everyone gangs up on you and you are pretty much doomed. Usually the next person at level 9 wins their battle because by now, everyone has exhausted their firepower on the previous potential winner. Here are some of the cards that can help or hinder you:
Through the game, Jackson embodies Bogost’s examples that “put theory into practice; [but] also represent practice as theory” and demonstrates that “writing is not the only method of engendering interest” (111). I have had the game for a while and all this time I never realized that Lovecraft is the creator of the monster Cthulhu until now. The game, and its monsters, generated an interest in Lovecraft’s works as a means to investigate the source of Jackson’s inspiration. Graham Harman writes that “no other writer is so perplexed by the gap between objects and the power of language to describe them, or between objects and the qualities they possess” as is H. P. Lovecraft. Yet Jackson takes Lovecraft’s ideas and creates something tangible and visible. We handle the cards and look at the pictures. The monster Cthulhu that Lovecraft never definitively describes is depicted on a card as “Great Cthulhu,” a level 20 monster. According to Harman,
Lovecraft’s major gift as a writer is his deliberate and skillful obstruction of all attempts to paraphrase him. No other writer gives us monsters and cities so difficult to describe that he can only hint at their anomalies. Not even Poe gives us such hesitant narrators, wavering so uncertainly as to whether their coming words can do justice to the unspeakable reality they confront (9-10).
Yet, as one can see from this card:
Jackson and Kovalic have come up with their own version of Lovecraft’s “unspeakable reality,” but, as Darren kindly pointed out, they have also transformed Lovecraft’s “horror” into something comic, thus inverting the original intent of his works. Jackson parodies Lovecraft’s ideas and the philosophical debate that surrounds his work. John Law devotes space in his article to the discussion of “Euclidian and Non-Euclidian Spaces” (95), but for Jackson Non-Euclidian spaces becomes:
Jackson takes a complex philosophical idea and turns it into something tangible and fun. If you draw this card, it is very useful within the game as treasure because it is not tied to a class, (some artifacts can only be used by certain classes so if you are not a cultist, for example, you cannot use an artifact usable only by a cultist), and the more treasure you have that you can use, the greater chance you have of winning the game. Also, throughout the game, if you accumulate treasure worth 1000 gold pieces, you can trade them in for a level (unless you are a level 9 of course). The great thing about Munchkin is that the player does not need to know what a Euclidean or Non-Euclidean space is to have fun. The player simply has to know how to use the card effectively.
However, chaos is the underlining rule of the game. There are always disputes over the rules or what a card really means or does and inevitably everyone thinks something different (usually to their advantage). Knowledge will not help you in these situations as “disputes should be settled by loud arguments among the players, with the owner of the game having the last word” (Game Rules 4). That would be me.
Works Cited
Bogost, Ian. “Carpentry.” Alien Phenomenology, or, What It’s Like to Be a Thing. Posthumanities. Minneapolis: U of Minnesota Press, 2012. 85-111. Print.
Harman, Graham. Selections from Weird Realism: Lovecraft and Philosophy. Winchester/Washington: Zero Books, 2012. Print.
Jackson, Steve. Munchkin Cthulhu Rules. 2007.
Law, John. “Objects and Spaces.” Theory, Culture & Society 19.5/6 (2002): 91-105.
The post Carpentry, Networks, and Munchkin Cthulhu appeared first on &.
]]>