The post Boot Camp: My Sad Life, Quantified appeared first on &.
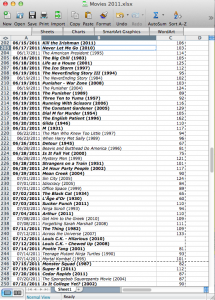
]]>Journalling takes us back some years to the emergence of the middle class, mercantiles documenting many of the more banal aspects of their day-to-day lives in keeping with the running of their households and businesses. Daniel Defoe elevated record-keeping to an art form with Robinson Crusoe, most of which is taken up in detailing inventories and explorations across the shipwrecked protagonist’s dessert island. At a certain point, personal archiving became the exclusive realm of those with the time and resources of a cosmopolitan upper class who knew they were already going to leave a mark on history: take for instance presidential libraries or Margaret Atwood’s meticulous preservation of everything she writes from manuscript drafts to correspondence to grocery lists. Today, everything is digital and automated, and the middle class is right back to journalling without even realizing it by way of life-hacking: we let apps and websites keep track of what we do in an effort to learn more about our own habits. Which brings me to me. Over the last few years, I’ve begun keeping track without understanding why. Earlier this year, my mother-in-law gave me a Fitbit One activity tracker that monitors my exertions, calorie intake and expenditure, and sleep quality; and since 2010 I’ve been using Shelfari to keep track of what I read (it used to be a lot of novels, and then I went back to graduate school and almost exclusively became theory and comics). But all of this is trumped by my great shame: for the past three years, I’ve been keeping a spreadsheet of all the movies I watch. And it’s a lot. (fig. 1)
(figure 1: a random sample of my movie watching habits. I could tell you a hundred things about how these records relate to each other)
Before I explain how this spreadsheet works, full disclosure: in the past 1,027 days (January 1st, 2011 to today), I’ve watched 951 movies. That’s not too embarrassing: it averages out to 1.079 movies a day 7.559 movies a week. Respectable, if only it was actually one movie a day and seven and a half movies a week. Instead, it ends up being zero movies some weeks and more than 20 other weeks. But I’m getting ahead of myself. The spreadsheet is simple: column A is the date I view a film, column B is the title and release year of the film, and column C is the film’s running time. A bold entry indicates if it was my first time seeing the film in question. In 2012, I start keeping a fourth column, D, that I mark if I saw the movie in theatres (in 2012 I saw 312 movies, only 12 of which were in theatres, and I didn’t start using Netflix until this summer, so I’m a dirty pirate). This chart alone is interesting to me, in that I can observe a thought process running throughout it: one actor or director leads to another, or seeing a particular genre film will remind of something along the same lines I haven’t seen in years. It’s a bit like Moretti’s flow of novel genre: some subtypes subtend toward others, which eventually supplant them.
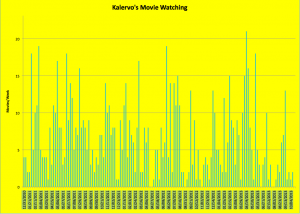
It wasn’t until a few days ago that I realized I should be writing my boot camp exercise about my own movie-watching habits, so I scrambled to learn enough about Excel to turn this spreadsheet into a histogram (fig. 2):
(figure 2: My movies per week for over 140 weeks. For a larger image click this: Kalervo’s Movie Watching)
It’s amazing what this chart tells me. I can connect huge spikes to times when I was doing a lot of writing or non-lit review research tasks (I like the background noise and must have ground through half of Hitchcock’s library writing a draft of my MA project in March of 2012), and I can connect drops to times in my life where I was otherwise occupied (the two biggest gaps are in late April of 2012, right after I finished my Master’s degree, and July/August of 2013, the month I got married). I can actually track major events, turning points, and trials in my life, just from the amount of movies I watched.
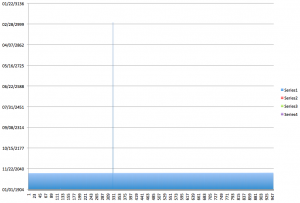
This was not easy. If the main point of these exercises is learn to do new forms of research, then the process of creating this histogram tells me a lot about how I should be doing things different in keeping my records, making my spreadsheet. For starters, Excel did not like the date format I was using. Getting around that took some time, and the first time I tried to put everything into a chart it came out a horrid mess (fig. 3):
(figure 3: my first attempt at a chart. Note the date range: 1904-3136. What?)
Secondly, bolding entries for new movies is useless in creating a visualization: Excel doesn’t recognize bold. I should have had things separated out a whole lot more: One column for title, another for year, another for if it was my first viewing of the title. If I had had just two extra columns, virtually no extra effort in the moment I create the record (as I was already adding year and newness, just not in different columns), I could have known a host of new things, from the time of year (if any) I tend to see new movies to what release years my viewing habits tend to favour. I can go back now and do that, but what would have been cake at the time is extremely tedious to do all at once now. And if I’d been more diligent in recording running times, I could have visualized total minutes spent watching movies as well (though frankly I’m relieved not to be able to show you that). It also wouldn’t hurt me to jazz the infographic up a bit. I’m far from Nicholas Felton’s annual Feltron reports in my aesthetic (see featured image), and while up until now I’d always appreciated him as a graphic designer, I imagine he must have quite a bit of programming know-how too in order to predict the kind of things his programs would expect from him in terms of valid input. The demystification of the process is also remystifying: while I know now bolding entries was not helpful, I’m not sure the ideal value to put into my new column for newness.
In any event, I’m actually extremely impressed by how useful this record can be about telling you about me. In quantifying myself and my habits, I also quantify a corpus of texts according to my own biography. And while I hold no illusions that I’ll be interesting for future generations of scholars, it gives an organizing principle to my every action. Everything we do when we journal and archive ourselves is imbued with extra meaning. How that meaning values for others is less important than the intrinsic value we can see for ourselves in our own lives lived.
The post Boot Camp: My Sad Life, Quantified appeared first on &.
]]>

